
Interrupt Handling and Stack Switching in x86-64 Architecture
Prelude
In this post I will attempt to explain interrupt handling and stack switching in x86-64 architecture. I decided to write this because I couldn’t understand the interrupt procedure call or how stack switches work in a lab from Xeno’s Architecture 2001: x86-64 OS Internals course at OpenSecurityTraining2. Therefore, with the help of Xeno’s slides and the Intel manual, I have tried to simplify and explain these topics here.
For anyone curious about the lab that started it all, I have also put together a writeup here.
Disclaimer
I am new to x86-64 OS Internals, so if there are any mistakes or necessary additions, please let me know on X.
Locating the Interrupt Descriptor Table (IDT): A Key Step in Interrupt Handling
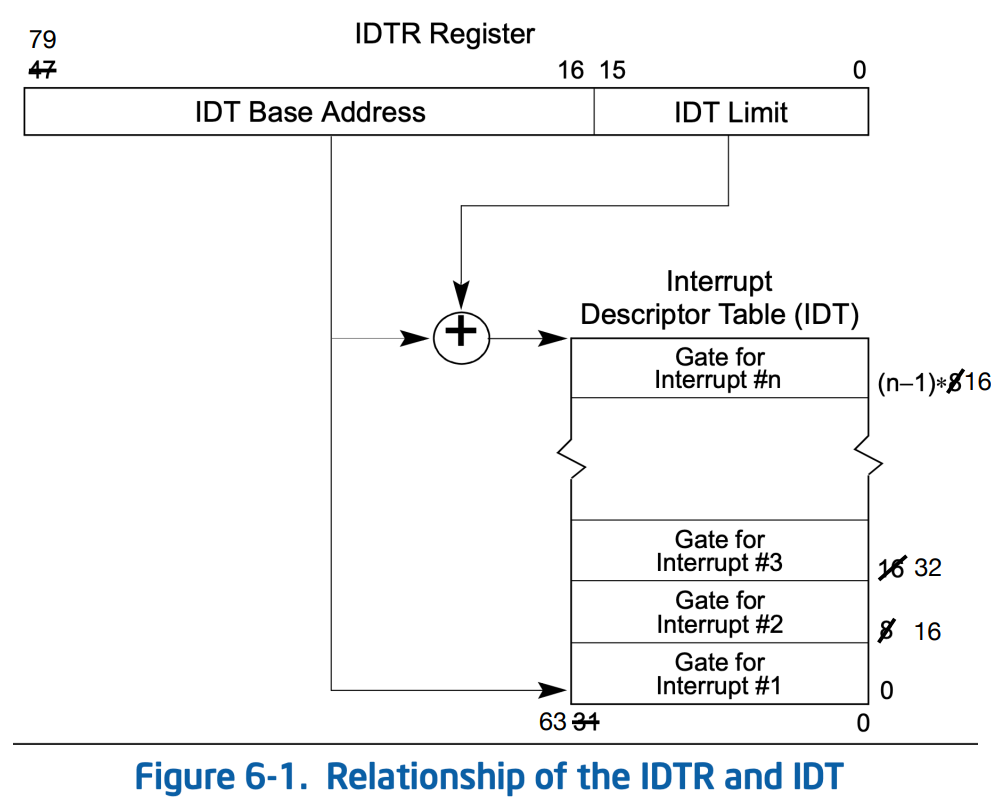
In the occurrence of an interrupt, the system’s hardware consults the Interrupt Descriptor Table Register (IDTR) in order to locate the Interrupt Descriptor Table (IDT). The LIDT (load IDT register) instruction, a privileged instruction, loads the IDTR with the base address and limit (as specified in Section 6-10 Vol. 3A). This base address points at the start of the IDT, and the limit specifies the size of the IDT:
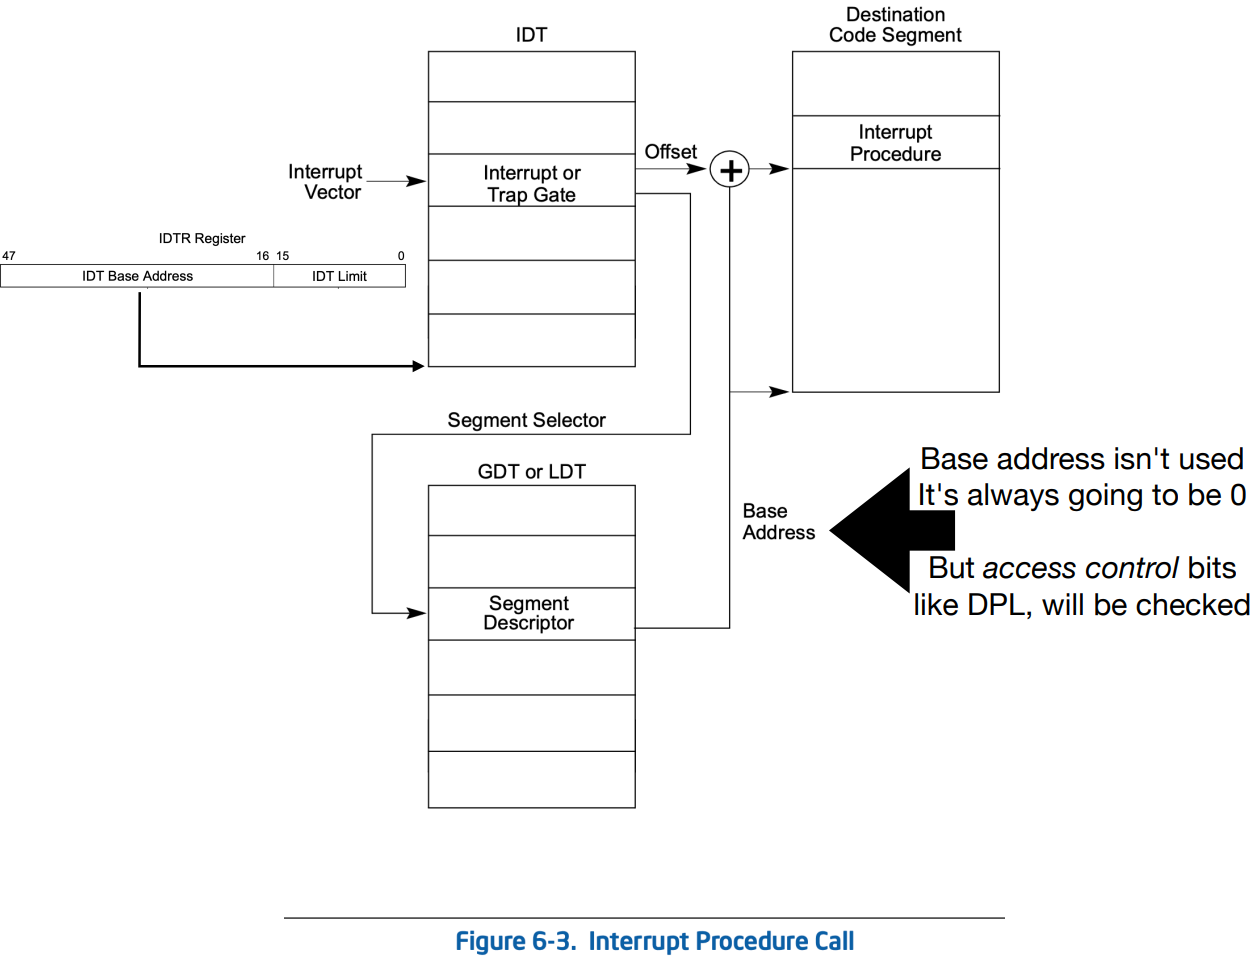
In order to access a specific descriptor in the IDT (in response to an exception or interrupt), the processor uses “the exception or interrupt vector as an index to a descriptor in the IDT” (shown in Figure 6-3 below). These exception/interrupt vectors can be found in Section 6-2 Vol. 3A of the Intel manual.
The descriptors in the IDT can be either Interrupt or Trap Gates, and each contain a segment selector and a 64-bit offset which tells the processor where the code for the exception- or interrupt-handler is located.
Xeno said “you can think of the IDT as an array of function (far) pointers, and when interrupt (vector) n is invoked by software or hardware, execution transfers to the address pointed to by the nth descriptor in the table. However, there will be checks for access control on the interrupt gate itself (in the IDT), as well as on interrupt procedure to which that interrupt gate points”:
Here is an overview of the privilege-level protection rules (Section 6.12.1.2 Vol. 3A of the Intel manual):
- General Rule for Exception and Interrupt Handlers:
- If the Current Privilege Level (CPL) is less than the Descriptor Privilege Level (DPL) of the Interrupt Gate, a general-protection (#GP) exception occurs.
- If the CPL equals the Interrupt Gate DPL, execution transfer is permitted.
- Software Interrupts (via assembly instructions like
INT n):- If the CPL is less than or equal to the Interrupt Gate DPL, execution transfer is permitted.
- For example, a transfer would fail if the CPL is
3and the Interrupt Gate’s DPL is0. - Conversely, a transfer where the CPL is
0and the DPL is3is permitted.
- For example, a transfer would fail if the CPL is
- If the CPL is less than or equal to the Interrupt Gate DPL, execution transfer is permitted.
- Hardware Interrupts (triggered by an external device such as network card, video card, keyboard, or USB device):
- DPL ignored.
- Special Conditions for Handler Execution:
- If the handler is placed in a non-confirming code segment with DPL of
0, it will always execute regardless of the CPL. - Similarly, if the handler is placed in a conforming code segment, it will also execute regardless of the CPL. This makes sense because conforming code segments are designed to be accessible by code running at any privilege level.
- If the handler is placed in a non-confirming code segment with DPL of
To see how these rules were tested, click here.
So, what is the CPL of the currently executing code? This can be determined by looking at the current Code-Segment and Code-Segment Descriptor.
In order to display the value of the CS register, you can use the WinDBG register command r cs:
0: kd> r cs
cs=0010
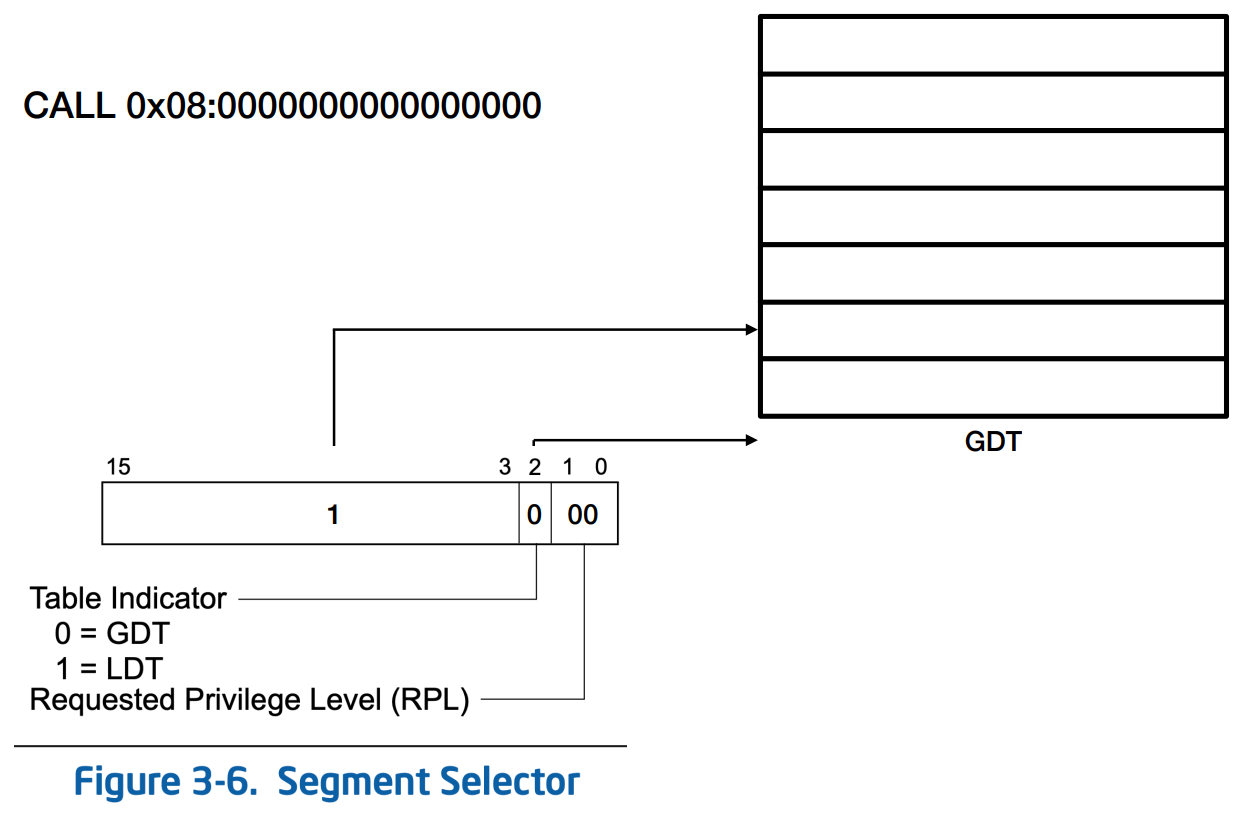
The Code Segment (CS) register contains an RPL (Requested Privilege Level), a TI (Table Indicator), and an index. Specifically, the RPL field, represented by the least significant bits (0 and 1) of any segment selector, specifies the requested privilege level of a segment selector. However, in the context of the CS segment register, bits 0 and 1 indicate the privilege level of the currently executing program or procedure.
In my case, TI is set to zero, so it points to the Global Descriptor Table (GDT). Specifically, it points at index 2 (00010000). The GDT indicates the memory location for the code segment. However, in 64-bit environments, it does not take a base or limit from there but assumes zero. Therefore, the information taken from the GDT is access information, specifying who is allowed to access this memory for this particular code segment, whether the kernel or user space.
In order to view the GDT, you can use !ms_gdt command with the SwishDBGExt plugin in WinDBG:
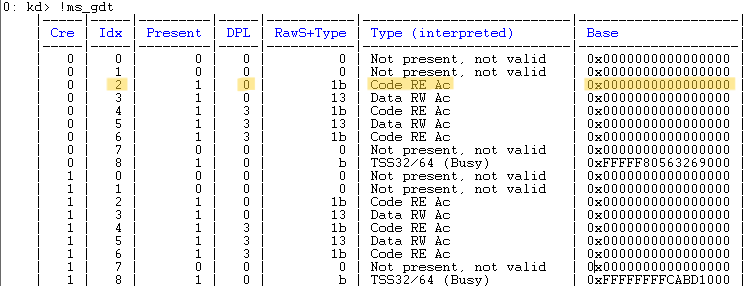
Here, we can see the DPL for index 2 is R0. The privilege level of the segment that the CS register points to (its DPL) is effectively the CPL of the currently executing code (R0).
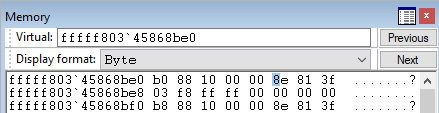
The DPL is also present in both Interrupt and Trap Gate Descriptors, indicated by bits 14:13 within the highlighted segment of bytes 7:4:
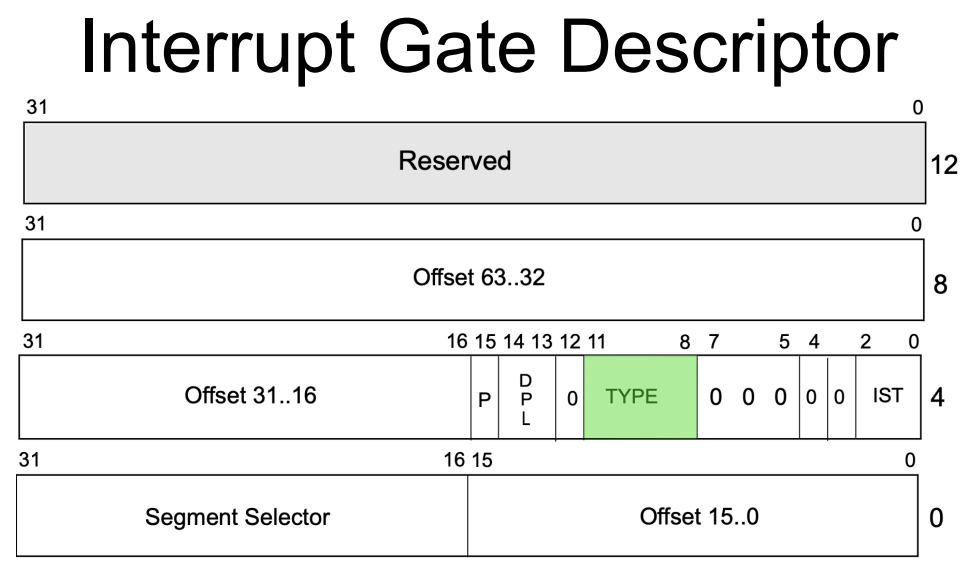
As outlined in the rules for exception and interrupt handling, the CPL and DPL are used to carry out privilege-level checks. For example, if a software interrupt is called and the DPL was set to zero and you were at CPL three, it would not allow you through.
There is also the stack-switch mechanism to consider (Section 6.12.1 Vol. 3A of the Intel manual):
- “If the handler procedure is going to be executed at a numerically lower privilege level (like ring
0), the processor performs a stack switch. This switch involves the Task State Segment (TSS). - If the handler procedure is going to be executed at the same privilege level as the interrupted procedure, the current stack is used.”
In the case of a stack switch:
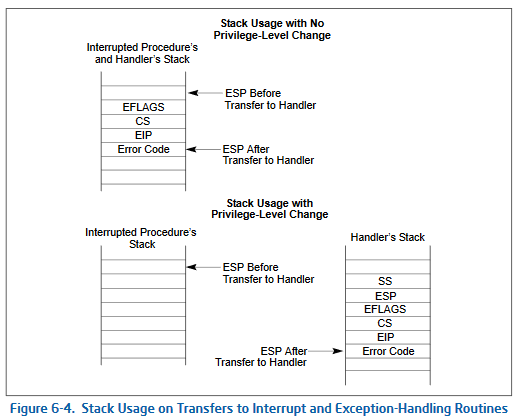
- “The segment selector and stack pointer for the stack to be used by the handler are obtained from the TSS (Task State Segment) for the currently executing task. On this new stack, the processor pushes the stack segment selector and stack pointer of the interrupted procedure.
- The processor then saves the current state of the EFLAGS, CS, and EIP registers on the new stack (see Figure 6-4 below).
- If an exception causes an error code to be saved, it is pushed on the new stack after the EIP value.”
So, after the stack switch, the processor uses the segment selector and offset (from the IDT entry) to locate and execute the interrupt or exception handler. This handler code will operate on the new stack.
In order to return from the handler, the IRET instruction is used, which will restore the state of the processor to what it was before the interrupt or exception, which includes a switch back to the original stack.
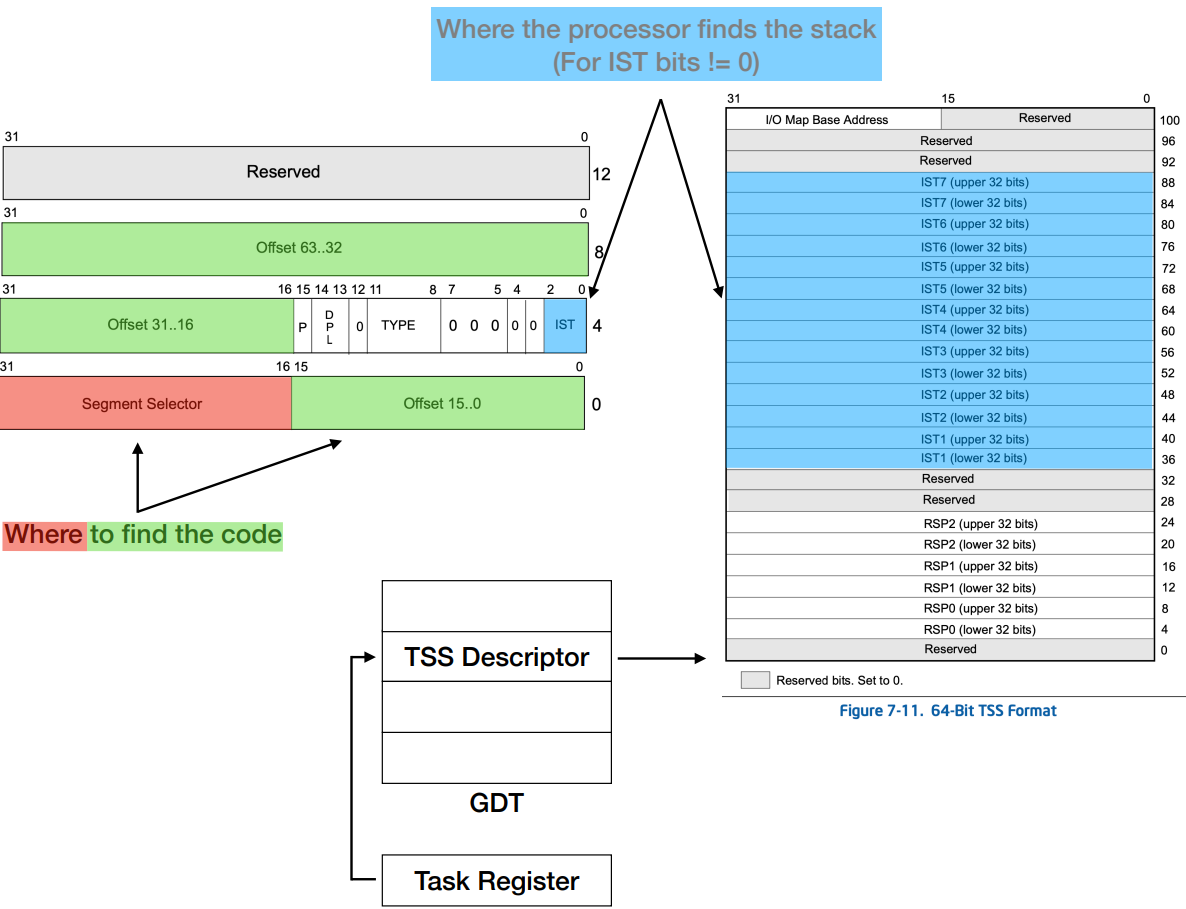
A stack switch can also occur if the Interrupt Gate Descriptor’s (IGD) Interrupt Stack Table (IST) bits are non-zero. It then uses the IST bits to specify a specific index from the Interrupt Descriptor Table (IDT) to use for the RSP (see Figure below). This stack is obtained from the TSS through a stack switch.
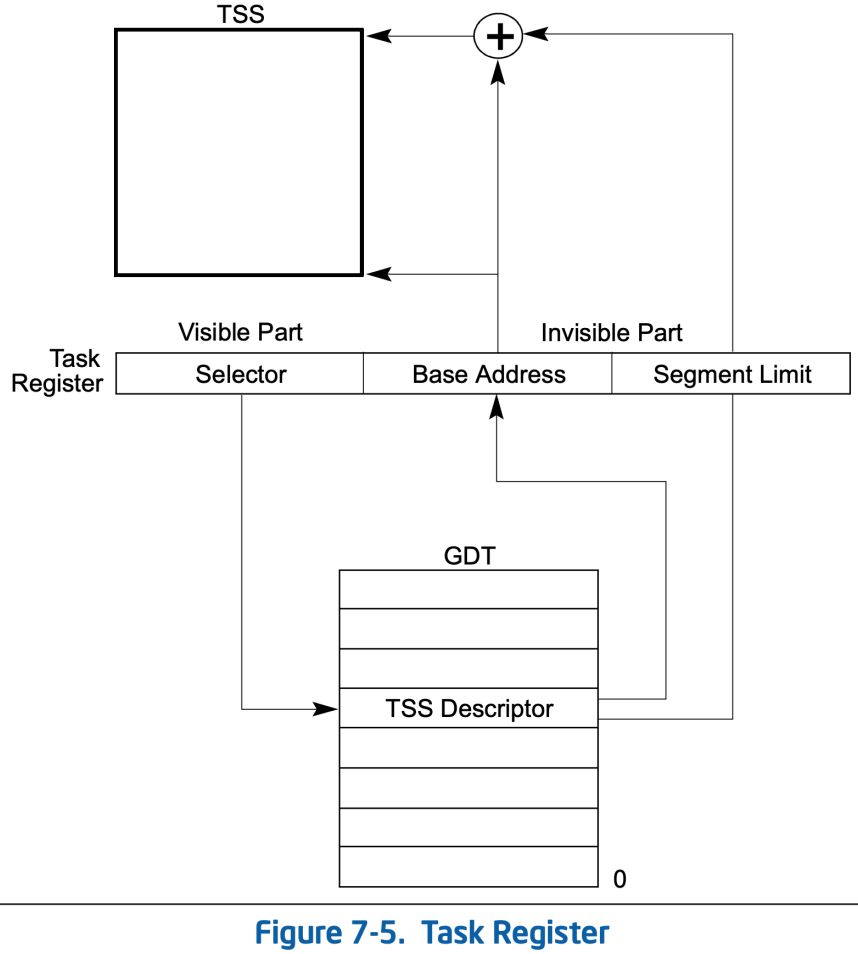
The Task State Segment (TSS) was referenced multiple times in relation to a stack switch. So, how does the processor actually locate the TSS?
The TSS is accessed through the Task Register (TR). The processor uses the segment selector in the TR to find the TSS descriptor in the GDT, and from this descriptor, it retrieves the base address of the TSS and can then access the TSS itself in memory.
This is what the TSS look at on 64-bit mode:
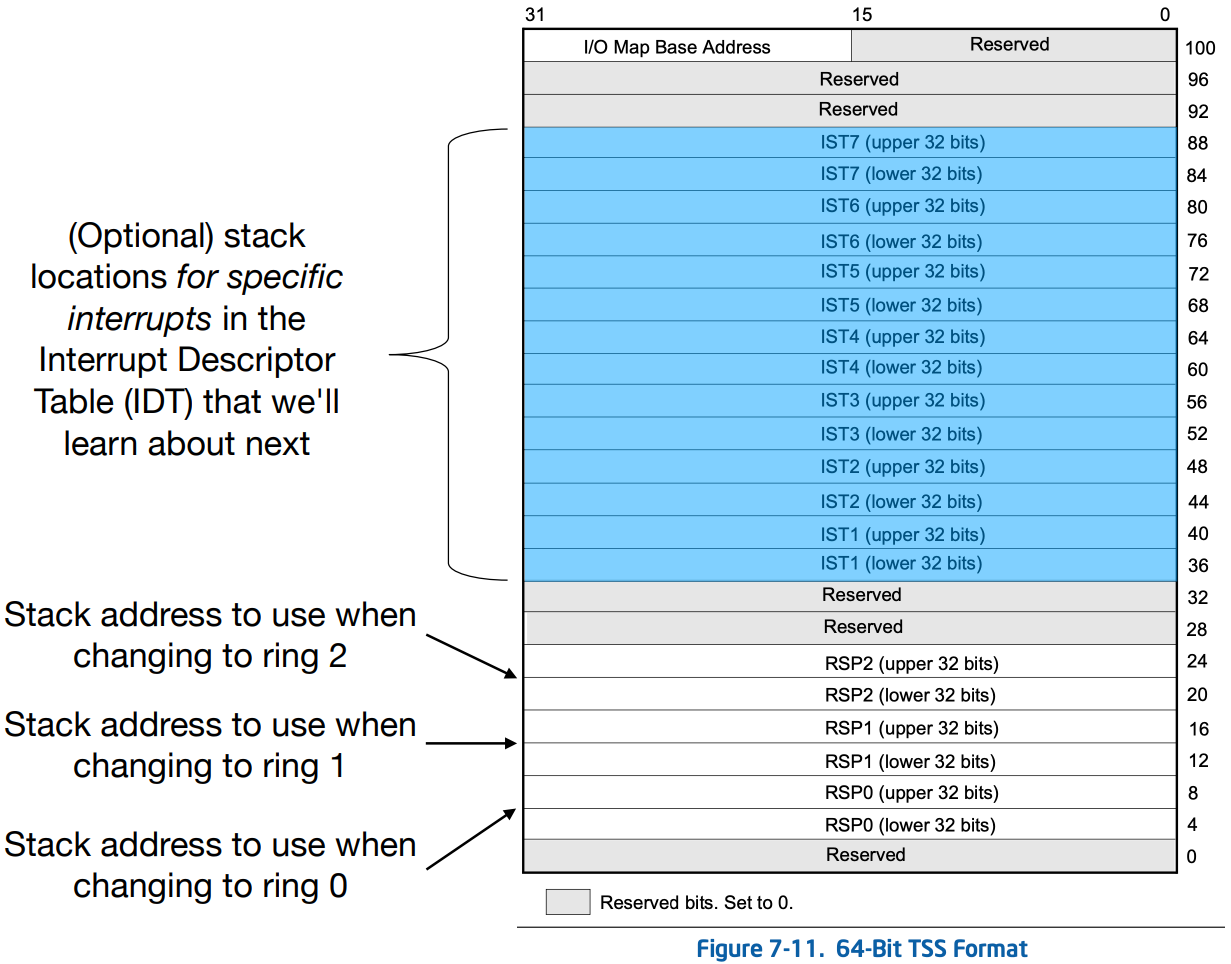
It includes RSPn which are the 64-bit stack pointers for privilege levels 0-2. RSPn are the addresses that will be used as the RSP in the case of a stack switch and point to the stack to be used when an interrupt occurs that transitions the processor into a lower privilege level (like Ring 0). This address specifies the top of the stack where the processor can push the stack segment selector, stack pointer, etc.
The TSS also includes 64-bit interrupt stack table (IST) pointers (ISTn). There are seven possible stack locations for specific interrupts (such as NMI, double-fault, and machine-check) in the Interrupt Descriptor Table (IDT) highlighted above.
Testing
To examine some of the privilege-level protection rules described in Section 6.12.1.2 Vol. 3A of the Intel manual, I used a boilerplate kernel driver and added a custom function that calls a user-defined interrupt (interrupts 32 to 255) from the IDT. Before the call, in WinDBG, I modified the entry’s DPL to observe various situations. In addition, I wrote a simple function to call an IDT entry (with a DPL of 0) from userspace. The code can be found here.
In kernelspace:
- Connect from WinDBG on the Debugger VM to the kernel on the Debuggee VM.
- In WinDBG on the Debugger VM, input
sxe ld [DriverName].sysin order to set a breakpoint atDriverEntry. - Install the driver on the Debuggee VM.
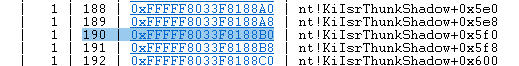
- In WinDBG on the Debugger VM, choose an IDT entry within the range of
32to255(currently set to entry180in the source code). The entire IDT can be viewed with the command!idtor through the SwishDBG plugin with!ms_idt. Then, find the pointer to this specific entry with the commanddq idtr L500:
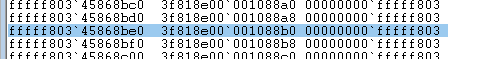
- Use the memory window in WinDBG to locate the address and adjust the DPL bits (
0x8forR0and0xEforR3).
- Enter
gto proceed and monitor WinDBG for any output.
In userspace:
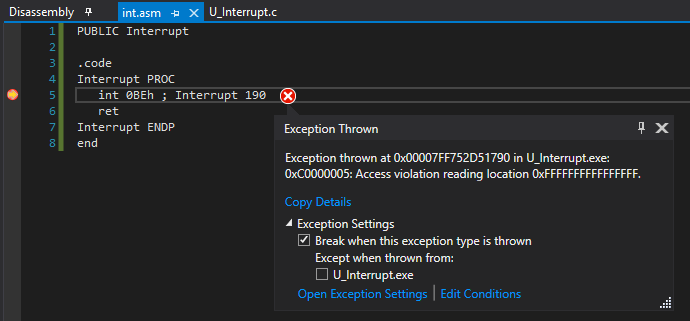
- I wrote a simple function to trigger interrupt
190, which had a DPL of0on my system. Given the CPL is at3, and interrupt190’s DPL is set to0, this resulted in an access violation exception:
Credits
Thank you to Xeno at OpenSecurityTraining2 for the incredible x86-64 OS Internals course and for the edited figures from the Intel manual used in this post.